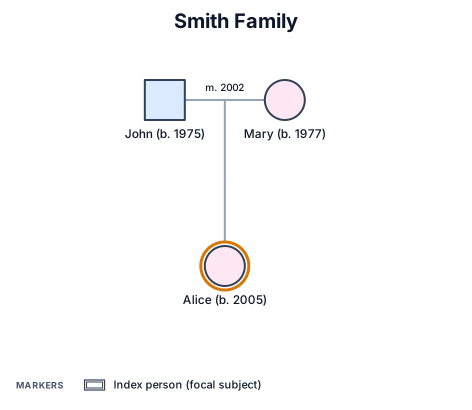
先從實際圖面開始。
描述您的需求,再透過對話逐步調整。
三個步驟,不用學繪圖工具。
- 01
描述您的需求
輸入需求,或附上照片或 PDF。
- 02
查看圖面
系統會將您的描述交由適合的引擎處理。
- 03
調整並匯出
提出修改需求、保留各個版本,再匯出結果。
常見問題
What is a pathophysiology flowchart and when should I use one?
A pathophysiology flowchart maps the chain of cause-and-effect events that drive a disease — from a root trigger through organ-level responses and downstream complications. Use one when studying for exams, teaching clinical reasoning, or presenting disease mechanisms in a research paper or grand rounds.
Can it show reinforcing feedback loops like the vicious cycles in diabetes?
Yes. Describe the condition and the AI generates a causal loop diagram with signed links (+ reinforcing, - inhibiting) and named loops — for example the R1 hyperglycemia-insulin-resistance cycle and the B1 compensatory pancreatic response in Type 2 diabetes.
Can I customize the diagram after it's generated?
Yes. Describe the example and request changes in the chat — the AI adjusts the diagram and explanation in seconds. You can add nodes, rewire causal links, rename loops, or narrow the diagram to a single organ system.
Can I export the diagram?
Yes. Export as PNG from the editor toolbar, or copy the diagram to paste into presentations and reports.
Is it free to use?
With a free account, you can create diagrams for free. No credit card is needed. You can save your work and generate diagrams.