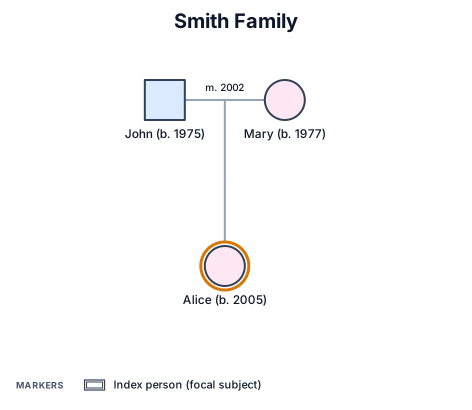
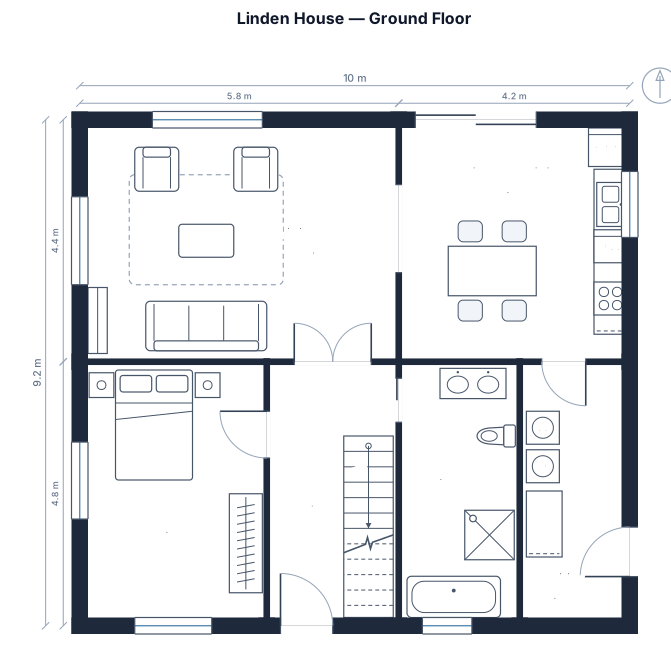
実際の図から始めましょう。
作りたい図を伝え、会話しながら仕上げましょう。
3ステップ。描画ツールを覚える必要はありません。
- 01
作りたい図を伝える
依頼内容を入力するか、写真やPDFを添付します。
- 02
図を確認する
内容に応じて適切なエンジンが選ばれます。
- 03
調整して書き出す
変更を依頼し、各バージョンを残して完成した図を書き出します。
よくある質問
What is a force-directed graph and when should I use one?
A force-directed graph places nodes so that strongly connected ones cluster together and weakly connected ones spread apart, revealing hidden structure in a network. Use it when you want to visualize social ties, knowledge dependencies, org influence flows, or any dataset where the pattern of connections matters more than a fixed hierarchy.
Can I show both positive and negative relationships in the same diagram?
Yes. The sociogram engine supports distinct edge styles for positive ties (solid arrows), negative ties (conflict/rejection markers), and neutral ties, so you can map trust, conflict, and indifference in a single diagram.
Can I customize the diagram after it is generated?
Yes. Describe the example and request changes in the chat — the AI adjusts node groupings, edge weights, labels, and layout in seconds.
Can I export the diagram?
Yes. Export as PNG from the editor toolbar, or copy the diagram to paste into presentations and reports.
Is it free to use?
With a free account, you can create diagrams for free. No credit card is needed. You can save your work and generate diagrams.