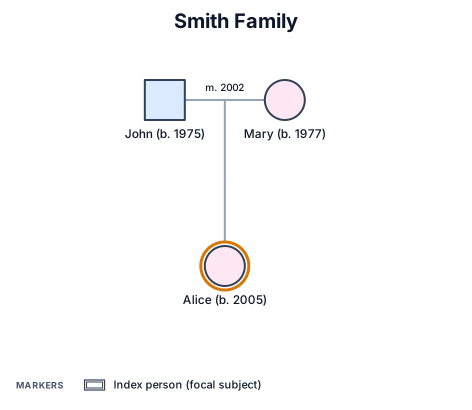
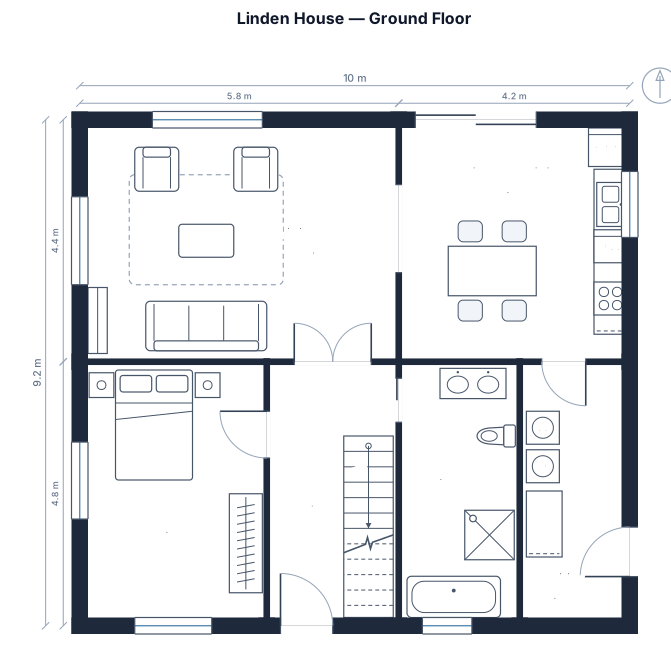
실제 도면으로 시작하세요.
필요한 내용을 설명하고 대화하며 다듬어 보세요.
그리기 도구를 배울 필요 없이, 세 단계면 됩니다.
- 01
필요한 내용 설명하기
요청 사항을 적거나 사진 또는 PDF를 첨부하세요.
- 02
도면 확인하기
설명에 맞는 엔진으로 자동 연결됩니다.
- 03
수정하고 내보내기
변경을 요청하고 버전을 보관한 뒤 결과물을 내보내세요.
자주 묻는 질문
What is a force-directed graph and when should I use one?
A force-directed graph places nodes so that strongly connected ones cluster together and weakly connected ones spread apart, revealing hidden structure in a network. Use it when you want to visualize social ties, knowledge dependencies, org influence flows, or any dataset where the pattern of connections matters more than a fixed hierarchy.
Can I show both positive and negative relationships in the same diagram?
Yes. The sociogram engine supports distinct edge styles for positive ties (solid arrows), negative ties (conflict/rejection markers), and neutral ties, so you can map trust, conflict, and indifference in a single diagram.
Can I customize the diagram after it is generated?
Yes. Describe the example and request changes in the chat — the AI adjusts node groupings, edge weights, labels, and layout in seconds.
Can I export the diagram?
Yes. Export as PNG from the editor toolbar, or copy the diagram to paste into presentations and reports.
Is it free to use?
With a free account, you can create diagrams for free. No credit card is needed. You can save your work and generate diagrams.